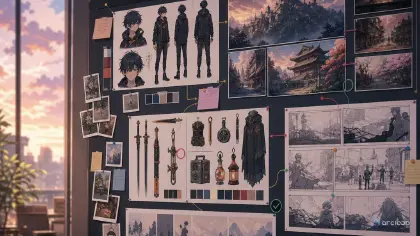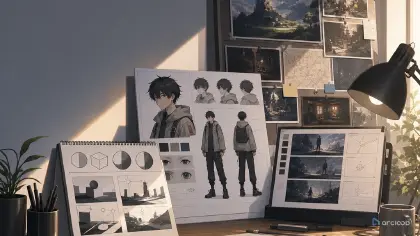

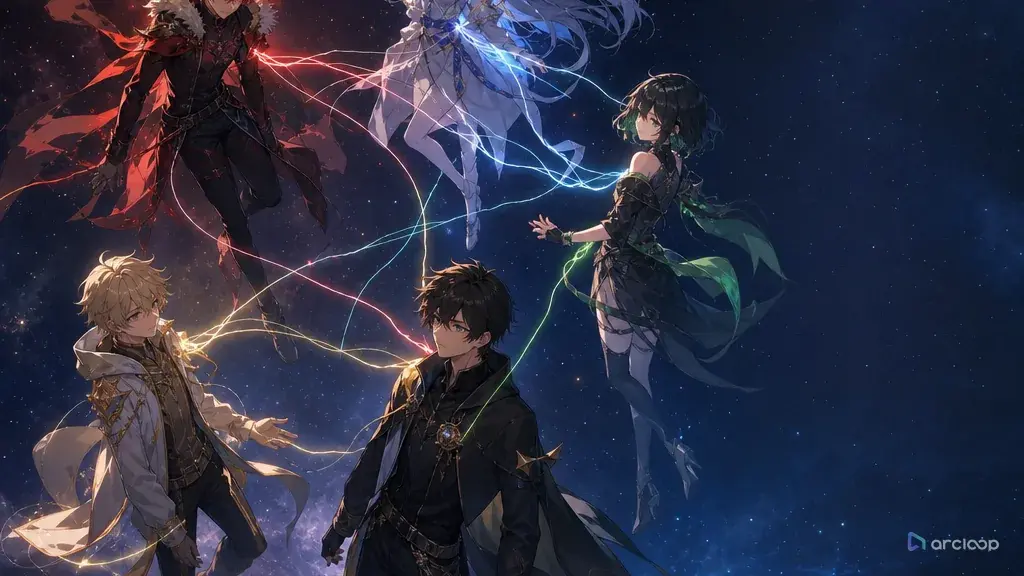
When a relationship chart becomes a messy poster
You try to make a character relationship chart for an anime short. The generated image has nice portraits, dramatic arrows, colored lines, and a background that looks expensive. Then you zoom in and realize the chart cannot be used. The labels are unreadable, the arrows cross everywhere, two characters look swapped, and none of the lines tell you what actually happens in a scene.
A useful relationship chart is not a decorative cast poster. It is a story tool. It should help you decide who pressures whom, who knows the secret, who blocks the lead, who is loyal in public but doubtful in private, and which relationship changes first. For AI anime production, the chart also has a second job: keeping character identity and scene dynamics stable across prompts.
This guide explains how to prompt character relationship charts that are readable, reusable, and connected to production in ArcLoop. It covers cast portraits, relationship lines, tension labels, faction grouping, layout rules, and how to turn a chart into storyboard and shot prompts. If portraits are not stable yet, start from the character asset fields breakdown. Then keep the working chart in ArcLoop Worlds alongside the rest of the project.
What makes a chart readable instead of decorative
The first principle is readability before decoration. If arrows, names, or factions cannot be understood at a glance, the chart has failed. A clean chart with plain spacing beats a beautiful poster that nobody can use.
The second principle is relationship verbs. "Friend," "rival," and "mentor" are too broad by themselves. Use verbs or pressures: protects, blackmails, trains, envies, suspects, covers for, owes, fears, tests, recruits, or betrays.
The third principle is stable portraits. Each cast portrait should reuse the approved character anchors from the sheet: hair shape, costume color, prop, expression, and silhouette. Relationship planning should not accidentally redesign the cast.
The fourth principle is line hierarchy. Not every relationship deserves the same visual weight. Main conflict lines should be bold or central. Background alliances can be thinner, grouped, or omitted from the first version.
The fifth principle is faction grouping. Place characters by team, family, school club, guild, enemy cell, household, or production unit when that helps the story. Spatial grouping reduces crossing lines.
The sixth principle is version control by story beat. A chart before episode one and a chart after the betrayal are different assets. Do not force the whole season into one static image if the relationships change.
How to structure a relationship chart prompt
Start with the chart purpose. Is it for writing, character design, a story bible, a social teaser, or internal shot planning? A public teaser can hide spoilers; a production chart should show the working truth.
List the cast with anchors. For each character, write name, role, visual anchor, and one relationship pressure. Keep this compact — it's the material you'll turn into character assets and portrait shots next.
Define the relationship types. Choose a small legend: trust, conflict, secret, dependency, rivalry, family, command, debt, or romance. Avoid too many line types in the first pass.
Choose layout logic. Put the protagonist in the center only if the story revolves around them. For faction stories, use clusters. For mystery stories, put the secret holder off-center. For ensemble comedy, use groups by daily location.
Write line labels as short phrases. "Owes a rescue," "hides the map," "tests loyalty," or "protects in public" gives more production value than a long paragraph.
Add visual constraints. Request clean spacing, readable portraits, consistent face and outfit anchors, no fake tiny text, no tangled arrows, no random extra cast, and no unreadable labels. If text rendering is unreliable, ask for blank label zones and write the exact relationship wording into the shot description instead, where it will actually be read.
Turn the chart into shots. After the chart works, use it to decide which characters belong in each scene. If a relationship line is important, it should become blocking, dialogue direction, gaze, distance, or a prop handoff in a later shot prompt.
Keep the chart beside the assets it describes
A relationship chart works best kept beside the character assets, scene beats, storyboard panels, and shot prompts it feeds — not planned in isolation. Keep it as a live reference in ArcLoop Worlds next to the rest of the project.
Build the chart in layers. First, create or attach character assets from character profile fields. Second, write a short note on what each character does in the story. Third, generate a relationship chart with clean layout and review criteria. Fourth, write scene prompts from the chart: who stands close, who avoids eye contact, who holds the shared object, and who blocks the exit.
When reviewing drafts, separate two questions. Did the chart preserve character identity? Did the chart explain story pressure? A take can have correct faces but useless lines, or clear lines with redesigned characters. Repair the failed layer only. For cast role logic, pair this with Character Cast Planning and Supporting Character Function Guide.
Here is how to wire the chart into ArcLoop so it stays a live planning tool rather than a one-off image.
First, open your IP Project and go to My Assets. Create a Character asset for each node in the chart — one asset per character, not one per costume. Upload the portrait you just approved to the Library, then Bind it to the asset as the Main image. If a character has a second look (uniform versus casual), bind that image as a Reference image on the same asset.
Next, open the Episode that starts at the relationship's key turning point. Click Generate Shots. In each shot card, use @CharacterName to pull identity in — you do not need to re-describe hair, costume, or face. Add only what is new in this specific shot: who stands where, what they hold, where they look, what the light does.
If you need multiple shots generated at once, open the AI Chat Panel and type: "Generate videos for Shots 1, 2, and 3." Once images are confirmed, generate video from the same cards.
Finally, move to Edit and arrange the shots on the timeline. If a shot shows the wrong relationship pressure — wrong distance, wrong gaze — swap only that card without rebuilding the whole scene.
Example 1: Relationship chart for a Lighthouse Academy mystery
Generate a clean 2D anime relationship chart for an original mystery short called "Lighthouse Academy After Curfew." Five character nodes: @Rell (protagonist, tan skin, short blue hair, cream academy cape, cracked compass pin), @Minae (rule keeper, long black ponytail, red glasses, navy armband, key ring), @Corvin (silver curls, orange hoodie under uniform jacket, pocket radio), @Yutri (dark green braid, patched boots, brass air-tank charm), @Head Aster (gray bob, white gloves, star chart folder). Relationship lines: Rell owes Minae a hidden apology; Minae suspects Corvin of the curfew signal; Corvin protects Yutri's secret diving route; Yutri found Rell's compass near the locked lighthouse; Head Aster tests all four. Layout: Rell center-left, Minae near the gate, Corvin and Yutri as a lower pair, Aster above. Color-coded lines for trust, suspicion, secret, and debt. Blank label zones for text. Clean spacing, no tangled arrows, no extra characters, no fake tiny text.
This prompt makes the chart useful for writing. The relationship lines are scene material, not vague status labels.
Example 2: Chart-to-scene blocking prompt
Medium-wide locked shot. Location: @map room — damp academy archive, blue-gray shadows, central table visible. @Rell stands center-left, cracked compass pin in hand, eyes on @Yutri. @Minae blocks the door screen-right, key ring visible at her hip. @Corvin sits on the window ledge, pretending to repair his pocket radio, thumb covering the light. @Yutri stands near the rolled sea maps, one patched boot hiding a wet footprint spreading on the floor. Head Aster's star chart folder rests on the table — Aster is absent. Relationship pressure through placement only: no dialogue, no text overlays. Motion: compass needle twitches, key ring swings once, radio light flickers, wet footprint spreads slightly. Clean 2D anime lighting. No extra students, no costume swaps, no portrait-poster framing.
The chart becomes blocking. Each relationship appears through placement, props, and gaze direction.
Example 3: Controlled revision for a tangled chart
Revise the existing relationship chart for "Lighthouse Academy After Curfew." Keep all five approved character assets: @Rell, @Minae, @Corvin, @Yutri, @Head Aster. Preserve every visual anchor — cracked compass pin, red glasses and key ring, pocket radio, brass air-tank charm, star chart folder. Do not redesign any character. Do not add new cast. Fix only chart readability: move @Rell slightly left of center; place @Minae at the door side; keep @Corvin and @Yutri as a lower pair; place @Head Aster above with a thinner authority line. Use thick lines for main suspicion and secret-route relationships, thin lines for background debt. Leave blank label zones — no tiny unreadable text. Reject if arrows cross faces, portraits drift, or decorative symbols appear that do not explain a relationship.
This revision asks for one repair: chart readability. It does not throw away portraits that already worked.
The most common chart failures
The biggest mistake is trying to show every relationship with equal force. Main story pressure should be easy to find. Minor friendships and background lore can live in notes or later versions.
Another mistake is using labels that do not create scenes. "Complicated" tells you nothing. "Hides the map from her" or "owes him a rescue" can become a shot.
Creators also make charts too text-heavy for generated images. If exact wording matters, keep the precise text in your own shot description and ask the image only for clean label zones or simple visual grouping.
A fourth mistake is letting chart generation redesign the cast. Use approved character assets as references and repeat the identity anchors. A relationship chart is not the place to reinvent hair, outfit, or props.
Finally, do not treat the chart as final truth forever. Update it after major story turns. A betrayal, confession, rescue, or failed promise should create a new version.
FAQ
What should a character relationship chart include?
Include the cast portraits, visual anchors, relationship verbs, line types, layout logic, and review criteria. For production use, also note which relationships must appear in the next scene.
How many characters fit in one relationship chart?
For a readable AI-generated chart, four to seven characters is a practical range. Larger casts usually need faction charts, episode charts, or separate protagonist-centered maps.
Should relationship charts include spoilers?
Internal production charts should include the truth needed to plan scenes. Public teaser charts can hide spoilers by using softer labels or omitted secret lines.
How do I turn a relationship chart into an anime scene?
Convert each important line into blocking, gaze, distance, prop handling, or reaction. If the chart says one character suspects another, show that through position and behavior in the shot prompt.
How do I keep a relationship chart connected to the character assets it describes?
Keep the chart, the character assets it references, and the storyboard in the same project. Then when you write a shot, pull identity in with @ and use the chart only to decide who appears and how they relate — it stays a live planning tool instead of a detached poster.